This article was originally written in June, 2019
Thinking about buying a house? Consider using the Fed’s “wait and see” strategy as your guide. Six months ago we expected to see the Fed push rates higher several times this year. However, recent data and a change in tone indicates we may be approaching a rate cutting environment with slower growth and more affordable buying opportunities.
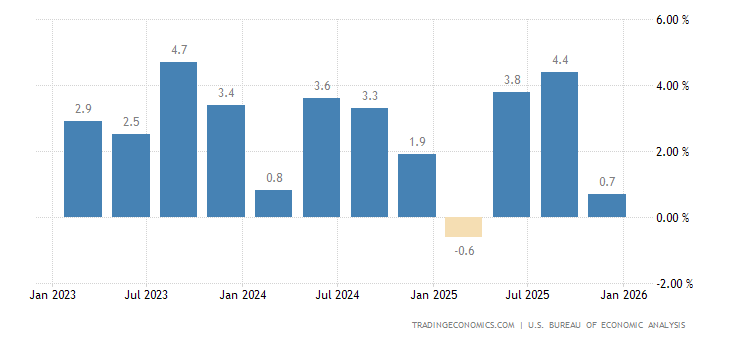
First thing’s first – Q1 GDP came in at a revised 3.1%. Personal consumption expenditures increased 1.3% as a whole – spending rose 2.1% on services and fell 4.6% on durable goods. Fixed investment went up 1.0% – Residential investment dropped 3.5% and investment for equipment also experienced a negative growth rate. Investment for intellectual property products rose 7.2%.
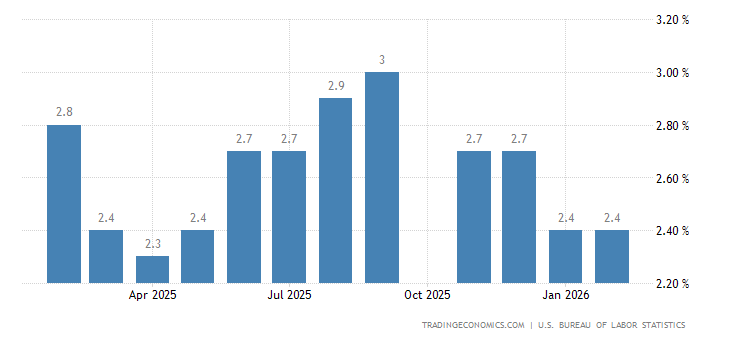
Inflation continued its 4-month decline in Q1, ultimately reaching an almost three-year low in February, then bouncing back to 2% in April. The Fed indicates inflation is in line with their long term goal, but if global turbulence knocks domestic demand off course, it won’t hesitate to cut rates and maintain positive economic growth.
Consumer sentiment popped on headline preliminary data reporting the highest reading since January 2004. However, two weeks after the original report, it was revised lower to reveal the index missed market expectations. This revision comes as confidence significantly eroded over the last two weeks of May due to unfavorable references to tariffs.
Irrespective of the actual price increases due to the most recent hike in tariffs, which include a 5% slap on all imports from Mexico in addition to an extra $250 M worth of Chinese goods, inflation expectations jumped to 2.9% in May. These higher expectations translate to real income expectations and directly effect spending on durable goods.
Trump tweeted he plans to increase the tariff by 5% each month either until it reaches 25% or Mexico does something to fix the immigration problem. Recent press reports state Chinese and Mexican exporters are fine with selling their goods at lower prices to capture the added cost of tariff and won’t mind suffering lower profits to fund the US government. If that were the case, why wouldn’t we set tariffs on imports coming in from all non-voting American citizens and let them pay taxes to fund the government? It’s without a doubt that the cost of these tariffs will be passed on to the American consumer. This is also concerning because Trump claims to have crafted the best trade deal in the history of trade deals to replace NAFTA. If Trump’s willing to throw that out the window for tariffs that the American consumer will pay, it goes to prove his stance on policy is extremely volatile and can’t be relied on by the economy.
The US unemployment rate fell to 3.6% in April and reached its lowest level since 1969. Wages and salaries disbursements from government, manufacturing and service industries were up 4.1% compared to the year before. Despite the Trump Administration launching ominous trade wars, weak global growth prevailing particularly in China and Europe, and the backlash of a disorderly Brexit, American consumers have every reason to continue to spend confidently.
Sales data doesn’t match “optimism”
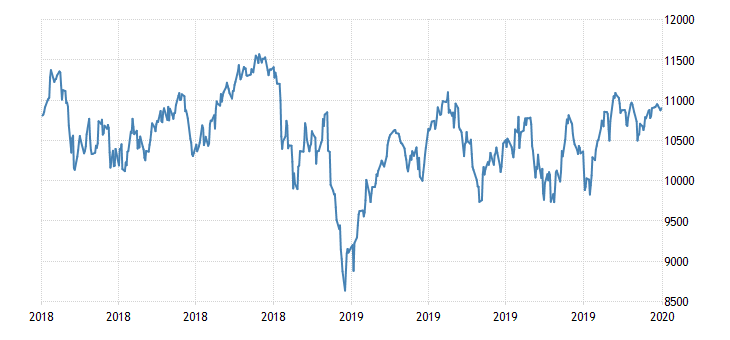
Transportation average loosely correlates to overall production
People buying more need to send more, which shows in cash flows to transportation companies. The Dow Jones Transportation Average index is down about 15% from its all-time high in September of 2018.
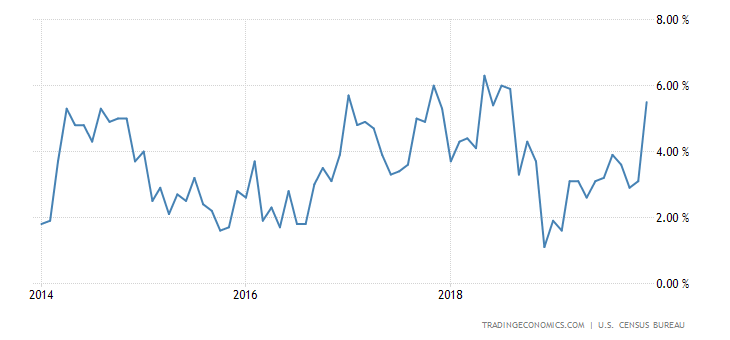
Retail sales data not promising
US retail trade growth slowed to 3.1% year-over-year in April, which is promising but still a slowdown from it’s growth rate for the majority of last year. If this slowdown in retail sales continues, this may be an early warning sign that domestic demand is not as strong as we believe.
Retail sales took an unexpected turn in April, dropping 0.2% MoM, following a strong month in March. More concerning is that almost half of the retail categories experienced month-over-over decreases:
- Motor vehicle & parts dealers: -1.1%
- Building material stores: -1.9%
- Electronics and appliances: -1.3%
- Health & personal care: -0.2%
- Clothing stores: -0.2%
- Online & male order trade: -0.2%
Retailers
- Sales to inventory ratios near highest levels since 2008
- Sales at Under Armour ($UA) dropped 13% in Q1 from the previous quarter
- Analysts expct Gap ($GPS) sales to fall 19% this quarter, compared to Q1. Stock closed June 4 almost 47% below 52-week high.
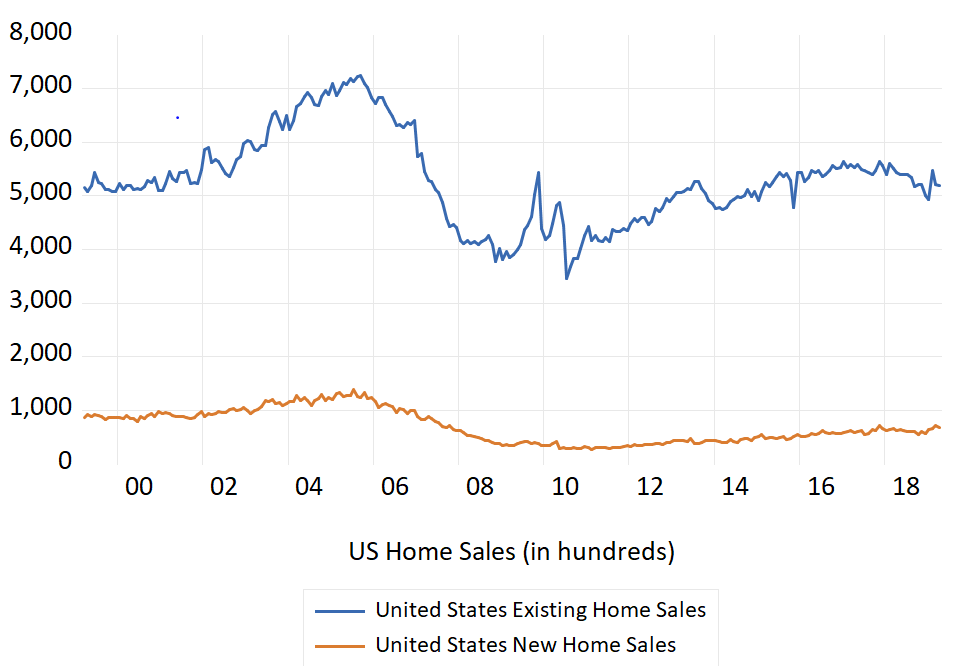
Home sales fall more than expected
Sales of new single-family houses in the United States dropped 6.9% from a month earlier, seeing an increase in the Northeast region but a drop everywhere else. At the current sales pace it would take 5.9 months to clear the supply of houses on the market.
| Region | MoM % Change | YoY % Change |
| West | (- 8.3) | |
| South | (- 7.3) | |
| Midwest | (- 7.4) | |
| Northeast | + 11.5 |
Sales of existing single-family homes fell 0.4% from the previous month and declined 4.4% year-over-year.
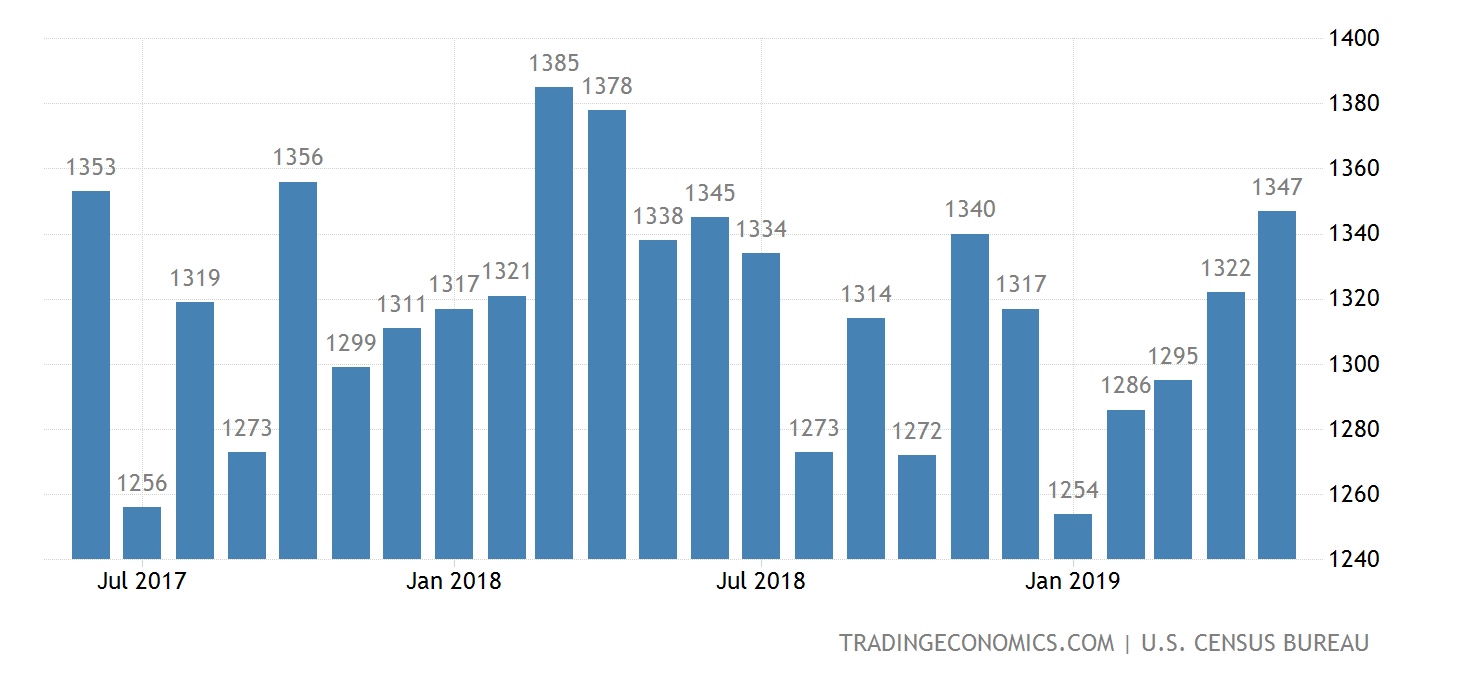
Building Permits and Housing Starts slow down
Building permits fell on the year, indicating fewer housing projects in the pipeline and awaiting approval. This shows builders aren’t currently building or planning to start building in the near future.
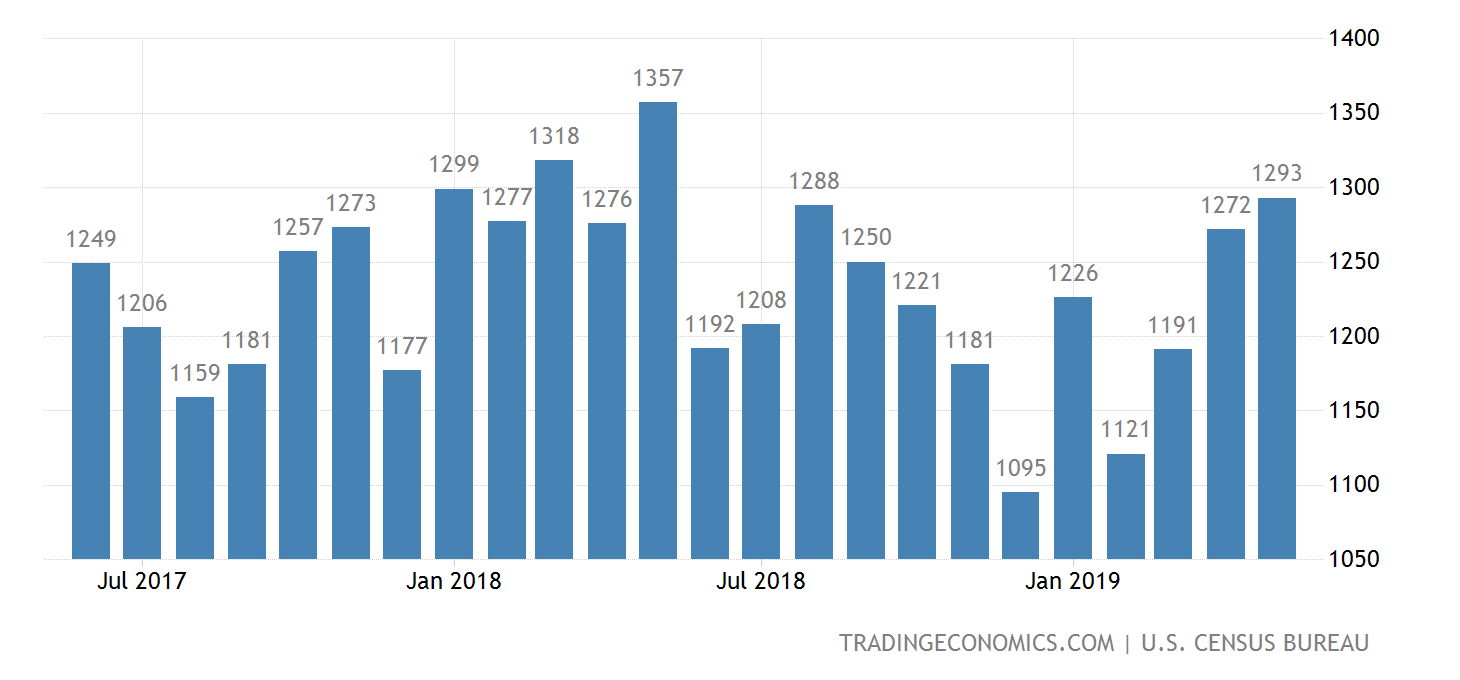
Housing starts fell and reached near two year lows in the beginning of the year before rebounding 5.7% in April. The number of new residential construction projects is still trending under January 2018 highs.
Home Price Indices
Pre-2008 recession, the value of a single-family home in Los Angeles was 47% higher than the national average. By the end of the crash, the premium on LA home values was cut to 7%. Currently, average home values in Los Angeles are 1.35 times greater than the national average.
The most recent data indicates that home values in LA are still trending upward, just not as fast as US National average. Why is price appreciation plateauing in Los Angeles and what can we expect in the next few months?
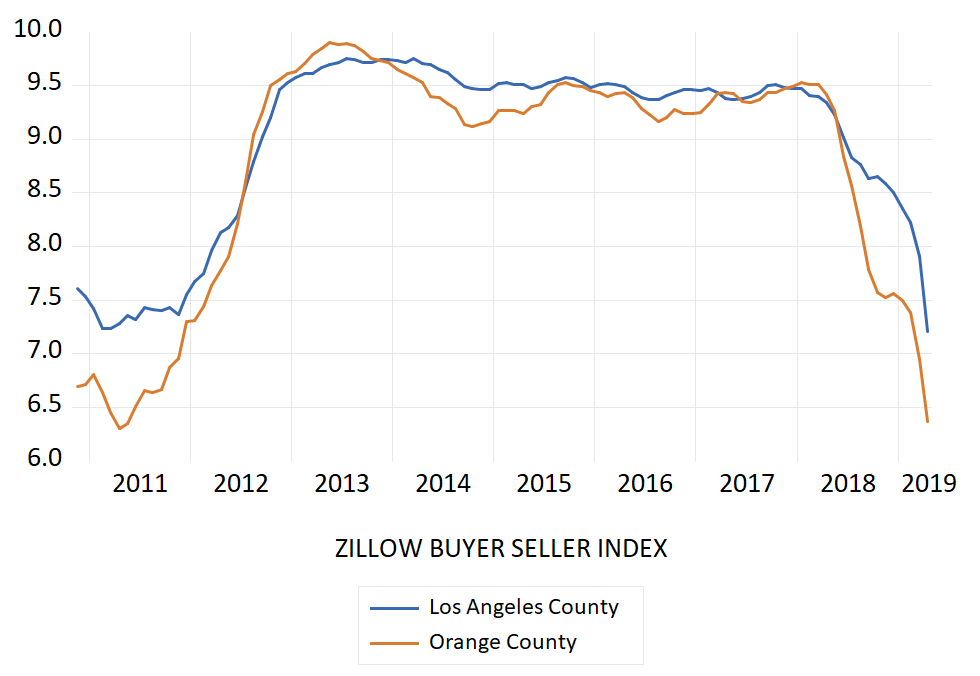
Overall Result: Shift to a Buyers Market
The Zillow Buyer-Seller Index (BSI) is a measure of the balance between sellers and buyers in a given market. When buyers are forced to compete for a limited supply of homes, sellers control the market and can justify pushing prices higher. On the flip side, when general lack of buyer demand means homes can linger on the market longer and ultimately sell for less, putting negotiating power in the hand of buyers. A low BSI index suggests seller pricing power is falling as a result of lack of demand, and buyers are regaining strength as sellers looking to get their homes off the market are forced to cut list prices.
A detailed methodology of how the index is created can be found here: https://www.zillow.com/research/understanding-the-zillow-buyer-seller-index-2883/
Homes are incredibly expensive right now for reasons which I believe stem from the fact that most housing and economic data reported in the media consist of headline figures. Social sciences make it easy to pick out one promising piece of data to report and base a narrative off of, but often times, the underlying data does not support the claims that can be made based on the headline.
Home prices to levels of income peaked in 2006 at a time when mortgage lending standards were extremely low. Buyers could place down payments on homes that weren’t affordable and the housing market benefited greatly. Price:Income ratios fell for almost six years before reaching a bottom in early 2012. As the economy recovered and buyers reentered the market, sellers continued stretch buyers capacity to pay by pushing prices slightly up.
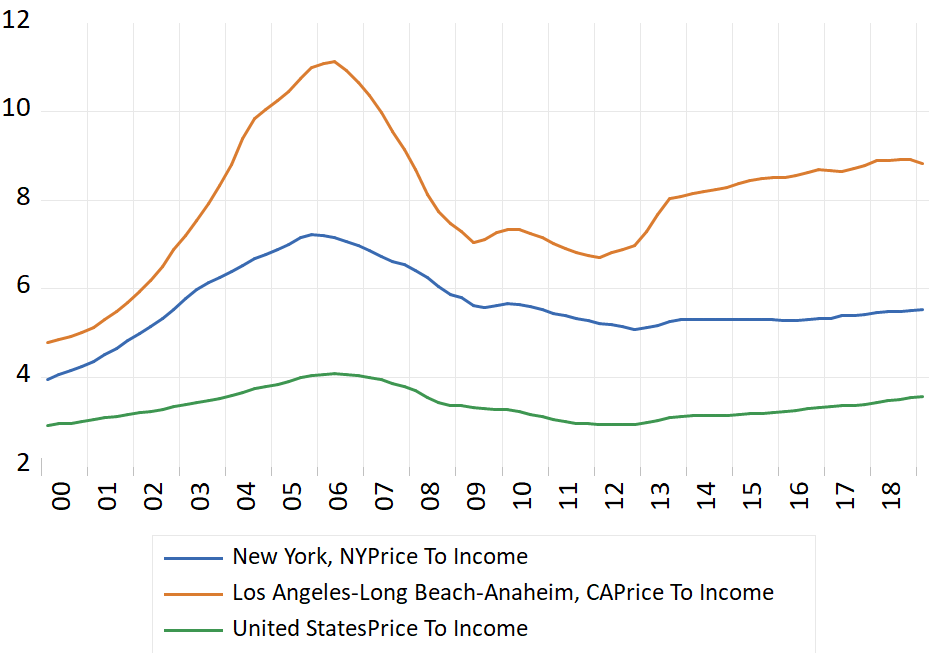
I believe this White House administration’s rhetoric has played a large part in price to income affordability continuing it’s upward trend to where we sit today near a 15 year high. As prices continue to come down and we see modest increases in average wages and earnings, I’m uncertain if this index will reach 2011 lows but regardless, homes will become more affordable.
A new normal?
Sure, until it’s not. The current data shows early warning signs that a change is coming. An increasingly conservative stance by the Fed on hiking rates in 2019, and the possibility of actually lowering them, provides a shaky truth to consumers optimism. In unison with retail sales data and the Dow Jones transportation indices, I don’t believe the domestic economy is as strong as some would like to believe from what they heard on Fox and Friends. Additionally, a slowdown in home buying activity and price appreciation in select markets shows that perceived demand is not as high as it was made out to be. I doubt investment spending on residential and non-residential buildings will see a significant uptick in the second quarter as consumers foresee less buying power due to perceived inflation.
TL;DR
Now is a terrible time to buy a house. Buyers have been priced out of the market by sellers who have been led to believe demand is strong. Price appreciation will continue to decelerate as buyers begin to take advantage of price cuts and set a new equilibrium. Sellers will catch on and cut prices as well. If home values and retail data continue to slide, we can expect a rate cut before the end of the year. This would obviously translate to more applications for low rate mortgages.
